FOUCAULT, A. and NOBLET-DUCOUDRÉ, N. de (2005). Climate change at the origin of Eurasian mammoth extinction? 2nd International Congress "The World of Elephants". Hot Springs (SD), USA. 22-25 sept 2005. Short papers and abstracts, pp. 55-56.
Climate
change at the origin of Eurasian mammoth extinction ?
Alain
Foucault, Muséum
National d'Histoire Naturelle, Dépt. Histoire de la Terre, 43,
rue Buffon 75005
Paris, France, foucault@mnhn.fr
Nathalie
de Noblet-Ducoudré,
Laboratoire des Sciences du Climat et de l'Environnement,
Bat. 709, Orme des Merisiers, 91191 Gif-sur-Yvette, France, noblet@lsce.saclay.cea.fr.
About twelve thousand years ago, Mammuthus primigenius,
the wooly
mammoth, vanished from Earth. In Eurasia, some other big species ceased
to exist
at the same time, among them Coelodonta
antiquitatis, Bison priscus, Megaloceros
giganteus, Ursus spelaeus, Panthera
leo spelaea, Crocuta spelaea. Other big species changed their
habitats, for
instance Ovibos moschatus and Saiga
tatarica.
Several hypothesis have been proposed to
explain these extinctions. Three were recently discussed. Without an
order of
preference, the first one is that hunting has been fatal for big
species, the
second one is that a lethal virus killed the mammoths, the third one is
that
climate changes put an end to the big mammal fauna, not directly, but
through
substantial modifications of their environment. We evaluate here the
latest hypothesis
for Eurasia. Environmental changes that occurred after the Last Glacial
Maximum
(LGM) could indeed be a good reason to explain these extinctions.
Two complementary
approaches can be
used for this evaluation. The first one focuses on the reconstructed
paleo-environnement from discrete analysis of sediment records,
essentially the
palynologic content, and on geomorphic arguments. The drawback of this
approach
is the lack of regional distribution of such data, and therefore the
impossibility to reconstruct coherent changes over large geographical
regions.
The second one uses climate and biosphere models. Climate and biosphere
models
use variations in insolation as input data, and simulate all
atmospheric
variables, e.g. temperature, precipitation, as well as the distribution
of
vegetation that is in equilibrium with the simulated climate. The main
problem
scientists are faced with, using this approach, is the potential lack
of
important feedback in the modeling framework that has been built. This
is why
many studies are devoted to comparing model results to data at
different time
periods, to assert the realism of the model used.
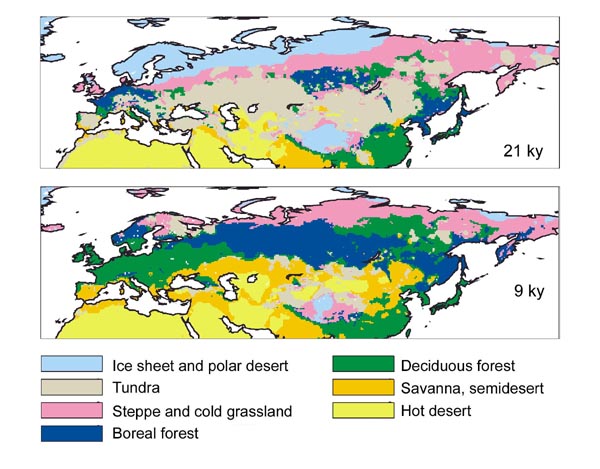
Maps issued from
modeling are far
more accurate in space and time than the ones issued from
sedimentological
records but some uncertainties remain about the repartition of biomes.
In our
case, if we compare the maps resulting from modeling presented here
(see figure)
with maps issued from palynologic and geomorphic data elaborated by
other
authors (1), we can see in some areas, as in western Europe, that,
during the
LGM, 21 000 years ago, the first ones showed forest whereas the
second
ones indicated steppes. These discrepancies could be attributed either
to
inaccuracies in mapping or to differences in the definitions of biomes.
Anyway,
both methods of mapping lead to the same general conclusions.
At the time of the LGM,
all the
non-glaciated parts of Eurasia were covered by tundra, tundra-steppe or
steppe.
This steppe is often called “mammoth steppe” (2) because of its
specific
composition that seems to have been particularly appreciated by this
big
mammal. Many authors have underlined that such a large extent of this
herbaceous association was the major reason for the great abundance and
variety
of herbivores that roamed this area at this time. Abundance and variety
of
carnivores ensue from the presence of their prey.
The climate change that
occurred
after the LGM was characterized by milder and wetter conditions less
favorable
for steppe growth but much more favorable for forest expansion.
Consequently,
forests that had taken refuge in few areas during the LGM, gradually
spread out
at the expense of the steppe. All maps of vegetation distribution show
that,
9000 years ago, there were very few remaining areas covered with steppe
vegetation in Northern Eurasia. The Northern part was occupied by a
tundra,
bordered to the South by a large belt of forests, deciduous forest to
the West,
and boreal forest to the East.
Without the steppe, or
at least
without larges areas of steppe in the Northern part of Eurasia, the
former association
of herbivores could not continue to exist and we are allowed to assume
that
these environmental changes have been sufficient to explain the
extinction of
several big species and the emigration of others. However, it is
difficult, in
the limited precision of our models, to certify that areas of steppe
did not
remain here and there, and could have been refuges for big herbivores
as it was
the case for St Paul (3) and Wrangel (4) Islands where mammoths
survived until
8000 and 3700 years BP respectively. For this reason, we cannot reject
the
hypothesis that hunting was the ultimate factor that put an end to
mammoth’s
life. But in this case, the same explanation has to be true for the
other
species that disappeared with them.
In conclusion, climate and environmental changes that occurred after the LGM seem a sufficient circumstance to explain the extinction of mammoths and associated faunas. Modeling of biome distribution must be improved to test the hypothesis that little populations of these mammals could have remained in refuges and eventually could have been killed by hunting.
(1) e.g.Petit-Maire, N. and
Bouysse, P. (coord.), 1999. Maps of the
World Environment during the last two Climatic Extremes. Commission
for the Geological Map of the World and ANDRA.
(2)
Guthrie, R. Dale, 1990. Frozen Fauna of the Mammoth Steppe: The Story
of Blue
Babe. The
University of Chicago Press.
(3) Guthrie, R. Dale, 2004. Nature 429:746-747.
(4) Vartanyan, S. L.,
Arslanov, Kh. A., Tertychnaya, T. V.,
Chernov, S. B., 1995. Radiocarbon 37
(1):1-6.
Figure.
Biome distribution 21 ky and 9 ky ago.